Living Systems_

Jinja

Debugging inside Jinja templates using pdb/ipdb

I’m working on a static reporting tool using the Jinja2 templating engine for Python. 
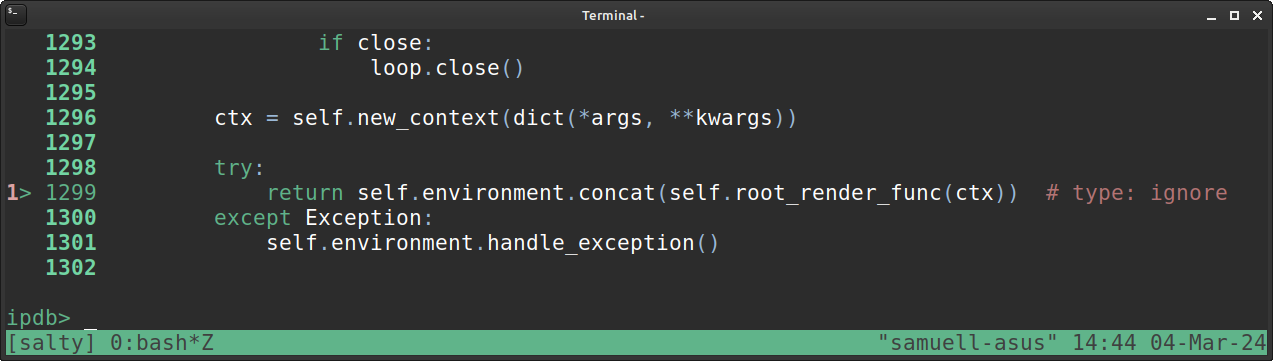
I was trying to figure out a way to enter into the Jinja templating code with the pdb/ipdb commandline debugger. I tried creating an .ipdbrc file in my local directory with the line: path/to/template.html:<lineno> … but that didn’t work. What worked was to figure out the line that says : return self.environment.concat(self.root_render_func(ctx)) … inside the the jinja codebase, and put a breakpoint on that (which for me was on line 1299, but might vary depending on version):